On August 17, 2015, I attended the Board of Public Utilities, BPU, hearings regarding New Jersey’s Energy Master Plan, EMP.
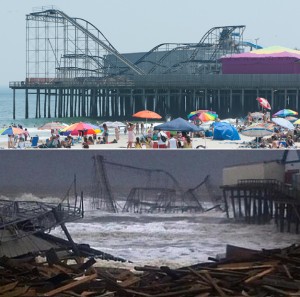
The beach and cyclone at Seaside Heights, NJ, before and after Hurricane Sandy, Oct. 2014
A lot of people, myself included, spoke about Sandy. (Photos, click here).
Many spoke of the need for the BPU to act independently of the Governor and think long term.
No one spoke about a need or want for more fossil fuels or more nuclear.
The lobbyist from the NJ GCA, The Gasoline, C-Store, Automotive Association told the commissioners how happy he was that he installed a solar energy system on his home and said that gas stations need robust electricity. They can’t simply install emergency generators that burn diesel or gasoline.
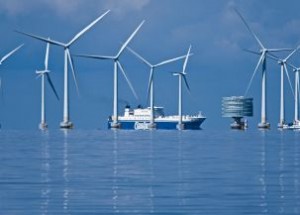
Lillgrund, Sweden, courtesy Siemens
I called for: 140% clean, renewable, sustainable electricity by 2030:
- Solar: 3.5 GW
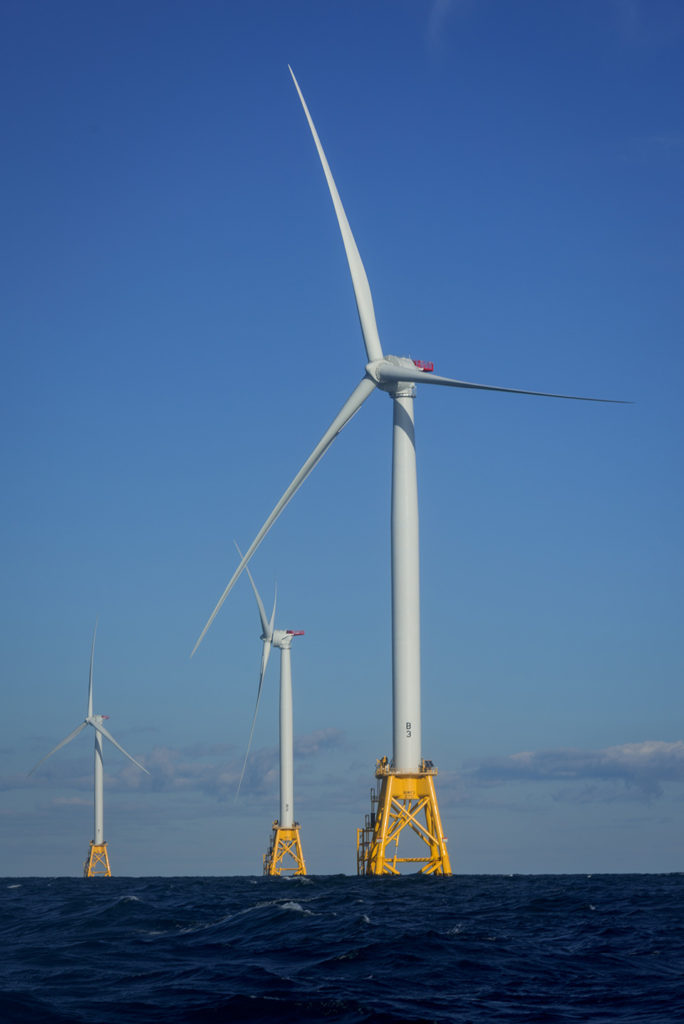
- Wind: 3.5 GW
- Batteries: 1.5 GW
- Biofuel: 1.5 GW
Including:
- 250 MW of solar in a 100 KW array on each of the 2500 public schools,
- 125 MW of battery backups, in a 50 KW Tesla Powerwall or equivalent system on each public school,
- These would give us emergency shelters, with power, in every community in New Jersey.
- A Capstone microturbine, or the equivalent at each sewage treatment plant.
These, I explained, would make the grid more resilient.
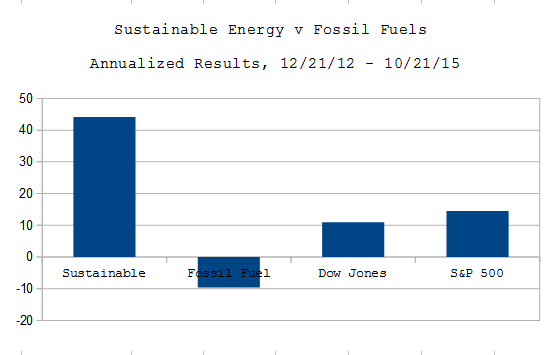
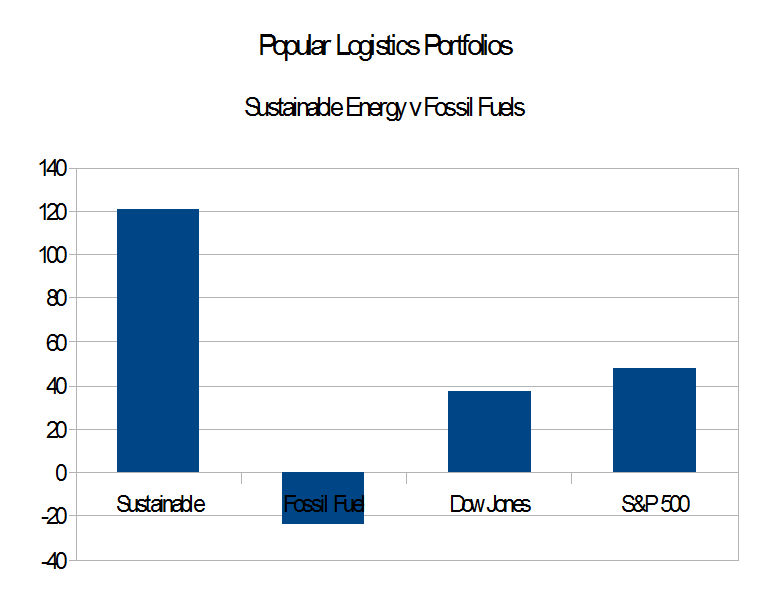
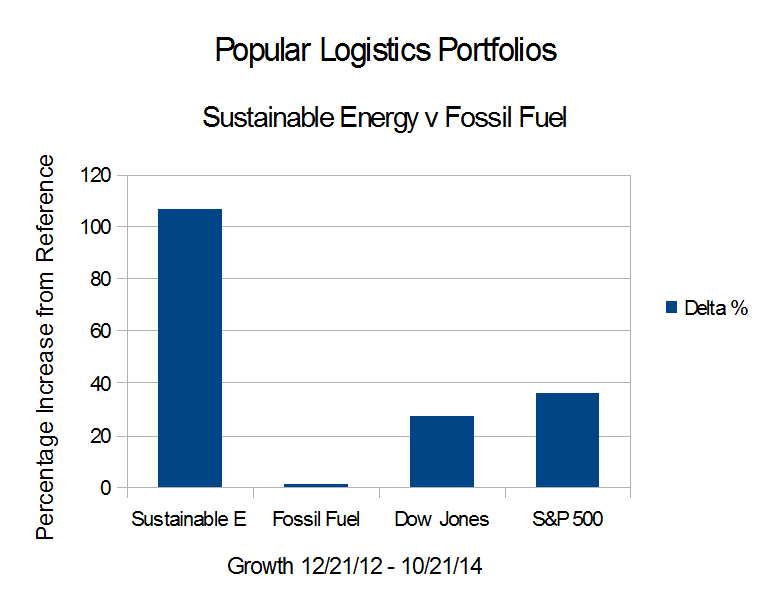
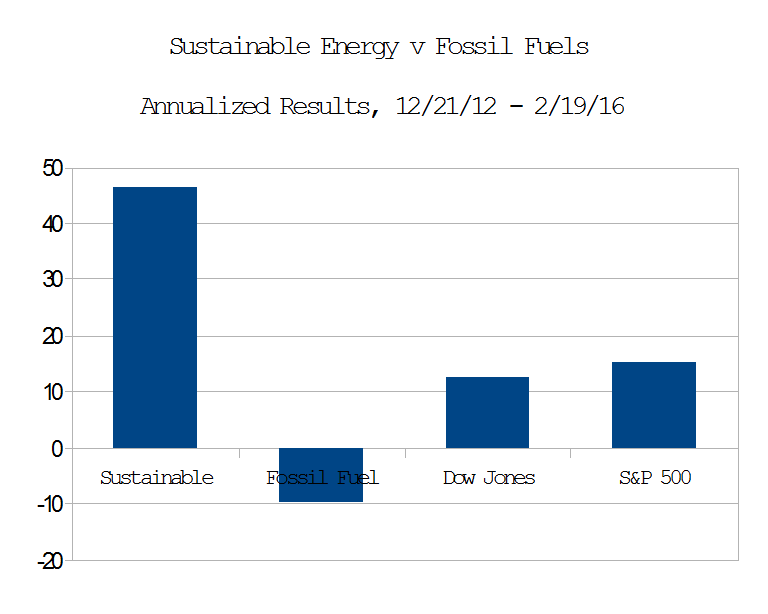
I also added that Wall Street appears to be abandoning fossil fuels. This observation is based on the data collected from Dec. 12, 2012, and published on Popular Logistics, here, that show that for the period from Dec. 21, 2012 to July 21, 2015,
- Sustainable Energy: Up 121%, 46.7% per year.
- Fossil Fuel: DOWN 25% overall, -9.26% per year,
- S&P 500: Up 47.54%, 18.41% per year.
The full text of my prepared remarks is below:
Continue reading →

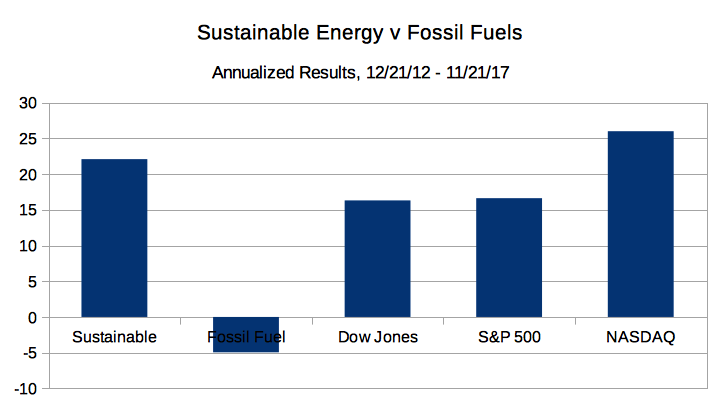
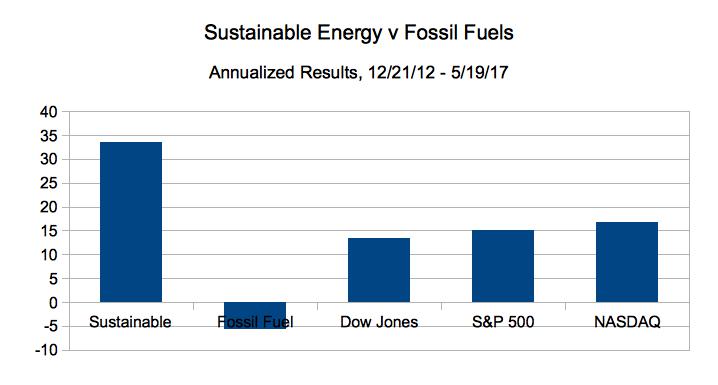
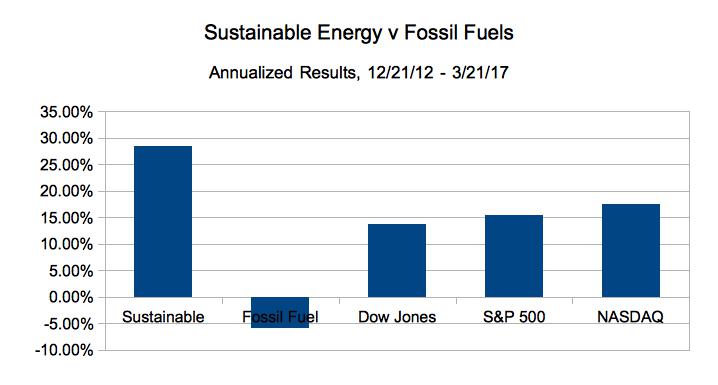
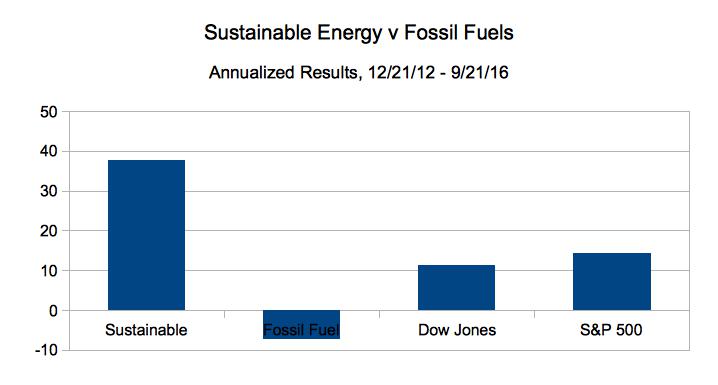
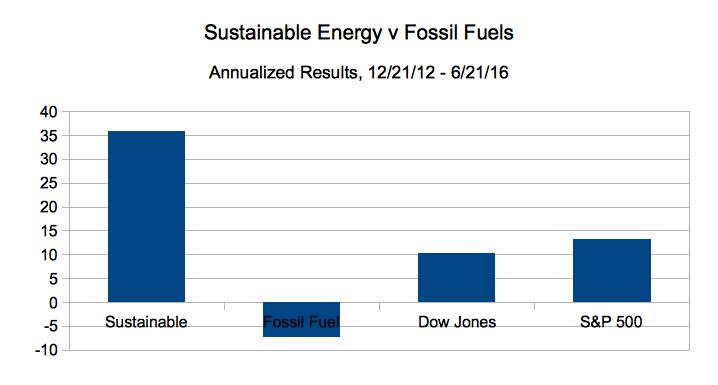
 On Dec. 21, 2012, I put $16 Million imaginary dollars in equal imaginary investments in 16 real energy companies; $8.0 in the Sustainable Energy space and $8.0 in the fossil fuel space. Excluding the value of dividends and transaction costs, but including the bankruptcy or crash of three companies in the sustainable energy space, and one company in the fossil fuel space.
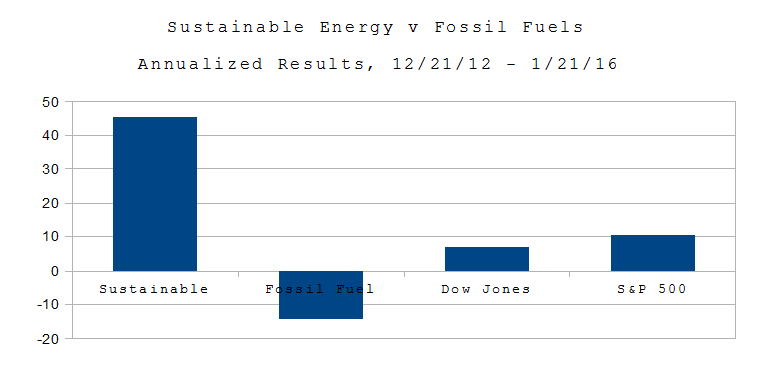 Wall St. 1/21/16. On Dec. 21, 2012, I put $16 Million imaginary dollars in equal imaginary investments in 16 real energy companies; $8.0 in the Sustainable Energy space and $8.0 in the fossil fuel space.
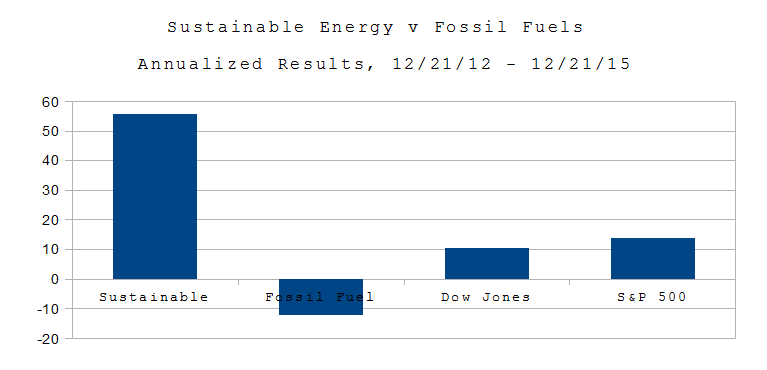 On Dec. 21, 2012, I put $16 Million imaginary dollars in equal imaginary investments in 16 real energy companies; $8.0 in the Sustainable Energy space and $8.0 in the fossil fuel space. Excluding the value of dividends and transaction costs, but including the bankruptcy or crash of three companies in the sustainable energy space.