Tag Archives: First Solar

Energy Portfolios: 3 Years, 10 Months: Sustainable Energy Up 130%, Fossil Fuel DOWN 26%

pl-port-16-10

On Dec. 21, 2012, I imagined $16 Million dollars in equal investments in 16 real energy companies; eight Sustainable Energy companies and eight Fossil Fuel companies. Excluding the value of dividends and transaction costs, but including the bankruptcy or crash of three companies in the sustainable energy space,

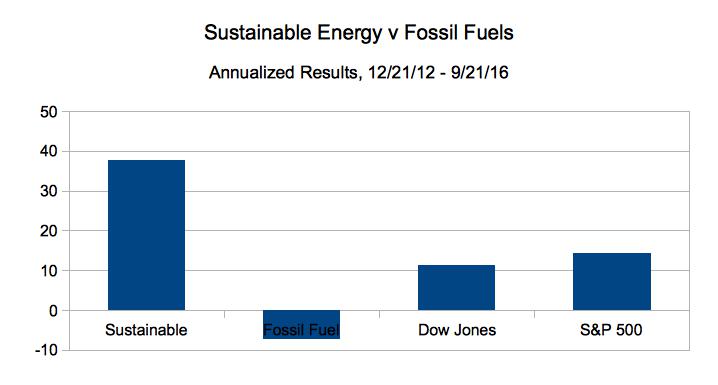
As of the close of trading on October 21, 2016:

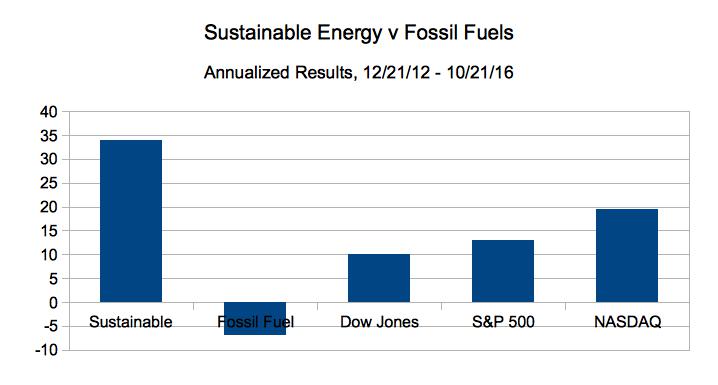
  • The Fossil Fuel portfolio had a good month, up $399,427, or 7.24$ since Sept, 21, 2016, it is down 26% overall, and 6.8% on an annualized basis, from $8.0 Million to $5.9 Million,
  • The Sustainable Energy portfolio is up 130.0% overall and 33.9% on an annualized basis, from $8 Million to $18.4 Million.
  • The Dow Jones Industrial Average is up 38.6% overall and 10.1% on an annualized basis from 13.091 to 18,146.
  • The S&P 500 is up 49.7% overall and 12.97% on an annualized basis, from 1,430 to 2,141.
  • The NASDAQ is up 74.0% overall and 19.44% on an annualized basis, from 3,021 to 5257.
Continue reading

3 Years, 9 Months: Sustainable Energy Up 134%, Fossil Fuel DOWN 31%

plp-1609

On Dec. 21, 2012, I imagined $16 Million dollars in equal investments in 16 real energy companies; eight Sustainable Energy companies and eight fossil fuel companies. Excluding the value of dividends and transaction costs, but including the bankruptcy or crash of three companies in the sustainable energy space.

As of the close of trading on September 21, 2016:

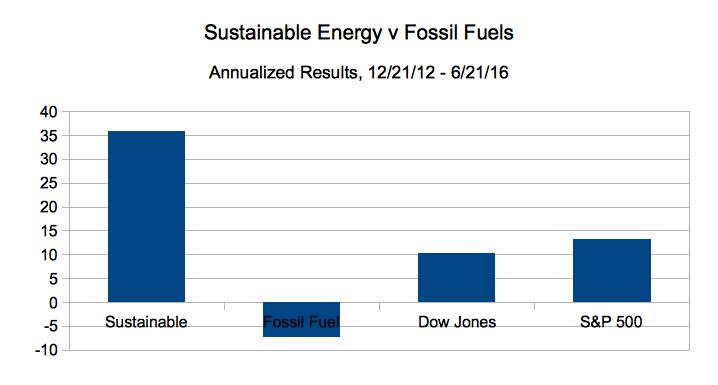
  • The Fossil Fuel portfolio went from $8.0 Million to $5.52 Million, down 31.05% overall, down 8.3% on an annualized basis.
  • The Sustainable Energy portfolio went from $8 Million to $18.7 Million, up 133.5% overall and 35.6% on an annualized basis.
  • The Dow Jones Industrial Average went from 13.091 on 12/21/12 to 18,294, up 39.7%, overall and 10.6% on an annualized basis
  • The S&P 500 went from 1,430 on 12/21/12 to close at 2,165, up 51.3% overall and 13.7% on an annualized basis.

The Sustainable Energy portfolio is composed of Cree (CREE) and Lighting Sciences (LSCG) in the LED space, GT Advanced Tech (GTAT), which at the time made solar ovens for cooking PV wafers. First Solar (FSLR) and Sunpower Corp. (SPWR) in the solar space, Vestas (VWSYF), a wind company, Solazyme (SZYM) a biofuel company and Next Era Energy (NEE), a utility.

The fossil fuel companies are the oil companies British Petroleum (BP), Chevron Texaco (CVX), Conoco Phillips (COP), Exxon Mobil (XOM) and RD Shell (RDS.A), the coal company Peabody Coal (BTU), and Haliburton (HAL) and Transocean (RIG), companies in the offshore oil and oil and gas drilling service industries.

The data are summarized beginning in Table 1, below.

Summary Data
Portfolio 12/21/12 09/21/16 Delta Delta % Annualized
Sustainable Energy 8,000,000 18,681,471 10,681,471 133.52% 35.60%
Fossil Fuel 8,000,000 5,515,027 -2,484,973 -31.06% -8.28%
DJI 13,091 18,294 5,203 39.74% 10.60%
S&P 500 1,430 2,163 733 51.26% 13.67%
Table 1

The stock price data for the Sustainable Energy portfolio are in Table 2, below.

Sustainable Energy Portfolio – Stock Prices
Item Company Symbol 12/21/12 09/21/16 Delta Delta %
1 Cree CREE 34.0 24.6 -9.42 -27.71%
2 First Solar FSLR 31.0 34.1 3.07 9.90%
3 GT Adv. Tech. GTAT 3.0 0.0 -2.98 -99.28%
4 Lighting Science LSCG 0.8 0.1 -0.67 -89.33%
5 Next Era Energy NEE 70.0 127.8 57.84 82.63%
6 Sun Power SPWR 5.4 8.1 2.62 48.25%
7 Solazyme SZYM 8.3 2.2 -6.19 -74.22%
8 Vestas VWS 6.3 83.2 76.85 1217.91%
Note that GTAT is currently in bankruptcy protection.
Table 2

The stock price data for the Fossil Fuel Portfolio are in Table 3, below.

Fossil Fuel Portfolio – Stock Prices
Item Company Symbol 12/21/12 09/21/16 Delta Delta %
1 BP BP 42.1 33.6 -8.51 -20.20%
2 Chevron Texaco CVX 109.7 99.6 -10.08 -9.19%
3 Conoco Philips COP 58.6 40.1 -18.54 -31.64%
4 Exxon Mobil XOM 87.2 83.3 -3.93 -4.51%
5 Royal Dutch Shell RDS.A 69.3 48.0 -21.30 -30.74%
6 Haliburton HAL 34.7 42.7 8.02 23.11%
7 Transocean RIG 45.6 9.1 -36.51 -80.00%
8 Peabody Coal BTU 395.3 1.6 -393.67 -99.60%
Table 3

The valuation data for the Sustainable Energy Portfolio are in Table 4, below.

Sustainable Energy Portfolio – Valuation
    Value Delta
Item Company Symbol 12/21/12 09/21/16 Delta Delta %
1 Cree CREE 1,000 723 -277 -27.71%
2 First Solar FSLR 1,000 1,099 99 9.90%
3 GT Adv. Tech. GTAT 1,000 7 -993 -99.28%
4 Lighting Science LSCG 1,000 107 -893 -89.33%
5 Next Era Energy NEE 1,000 1,826 826 82.63%
6 Sun Power SPWR 1,000 1,483 483 48.25%
7 Solazyme SZYM 1,000 258 -742 -74.22%
8 Vestas VWS 1,000 13,179 12,179 1217.91%
total 8,000 18,681 10,681 133.52%
Values in thousands.
Table 4

The valuation data for the Fossil Fuel Portfolio are in Table 5, below.

Fossil Fuel Portfolio – Valuations
Value Delta
Item Company Symbol 12/21/12 09/21/16 Amount Per Cent
1 BP BP 1,000 798 -202 -20.20%
2 Chevron Texaco CVX 1,000 908 -92 -9.19%
3 Conoco Philips COP 1,000 684 -316 -31.64%
4 Exxon Mobil XOM 1,000 955 -45 -4.51%
5 Royal Dutch Shell RDS.A 1,000 693 -307 -30.74%
6 Haliburton HAL 1,000 1,231 231 23.11%
7 Transocean RIG 1,000 200 -800 -80.00%
8 Peabody Coal BTU 1,000 4 -996 -99.59%
total 8,000 5,472 -2528 -31.60%
Values in thousands.
Table 5

The market capitalization data for the Sustainable Energy Portfolio are in Table 6.

Sustainable Energy Portfolio
Market Capitalization (Billions)
Item Company 12/21/12 09/21/16 Delta Delta %
1 Cree 3.90 2.54 -1.36 -34.87%
2 First Solar 2.69 3.52 0.83 30.86%
3 GT Adv. Tech. 0.36 0.00 -0.353 -98.88%
4 Lighting Science 0.15 0.00 -0.153 -100.00%
5 Next Era Energy 29.60 60.67 31.07 104.97%
6 Sun Power 0.88 1.13 0.2521 28.72%
7 Solazyme 0.52 0.18 -0.3357 -64.72%
8 Vestas 1.48 18.42 16.94 1144.59%
total 39.58 86.467 46.8904 118.48%
Table 6

The market capitalization data for the Fossil Fuel Portfolio are in Table 7.

Fossil Fuel Portfolio – Market Capitalization
Market Capitalization (Billions)
Item Company 12/21/12 09/21/16 Delta Delta %
1 BP 133.8 108.75 -25.05 -18.72%
2 Chevron Texaco 214.7 192.42 -22.28 -10.38%
3 Conoco Philips 71.2 52.04 -19.16 -26.91%
4 Exxon Mobil 397.7 349.48 -48.22 -12.12%
5 Royal Dutch Shell 216.8 204.67 -12.13 -5.60%
6 Haliburton 32.2 38.22 6.02 18.70%
7 Transocean 16.4 3.61 -12.79 -77.99%
8 Peabody Coal 6.37 0.03 -6.342 -99.56%
total 1089.2 949.22 -139.952 -12.85%
Table 7

The market capitalization data for the Big Oil portion of the Fossil Fuel Portfolio are in Table 8.

Big Oil Portfolio – Market Capitalization
Market Capitalization (Billions)
Item Company 12/21/12 09/21/16 Delta Delta %
1 BP 133.8 108.8 -25.05 -18.72%
2 Chevron Texaco 214.7 192.4 -22.28 -10.38%
3 Conoco Philips 71.2 52.0 -19.16 -26.91%
4 Exxon Mobil 397.7 349.5 -48.22 -12.12%
5 Royal Dutch Shell 216.8 204.7 -12.13 -5.60%
total 1034.2 907.4 -126.84 -12.26%
Table 8

  1. L. Furman, 12/21/12, Popular Logistics Sustainable Energy Portfolio
  2. L. Furman, 2/8/13, Nega-Watts, Nega-Fuel-Watts, Mega-Bucks
  3. L. Furman, 2/9/13, Gold Bricks and Sink-Holes – The Risk & Reward of Fossil Fuel, Solar & Wind
  4. L. Furman, 3/2/13, Sustainable Energy Portfolio UP 16% & Fossil Fuel Portfolio Up 1.7% – Since Dec.21, 2012
  5. L. Furman, 3/23/13, Portfolio Simulation At 3 Months: Sustainable Energy: Up 22%. Fossil Fuels: 3%
  6. L. Furman, 4/26/13, Earth Day, 2013. Oil Spills, Explosions, Fracking Business As Usual & The Stock Market Response
  7. L. Furman, 5/13/13, Popular Logistics Energy Portfolios: The Trend Continues.
  8. L. Furman, 6/24/13, Popular Logistics Energy Portfolios: At 6 months
  9. L. Furman, 7/22/13, Popular Logistics Energy Portfolios: Sustainable Energy Doubles. Fossil Fuels increase 5.4%
  10. L. Furman, 8/22/13, Popular Logistics Energy Portfolios: An Exercise in Climate Capitalism
  11. L. Furman, 9/20/13, Energy Portfolios – Investing for the Future
  12. L. Furman, 10/21/13, Sustainable Investing – Green Energy, Green Economy
  13. L. Furman, 11/22/13, Energy Portfolios: Minor Corrections, Overall Results In Line With the Trend
  14. L. Furman, 12/23/13, Energy Portfolios at One Year Sustainable Energy up 140%. Fossil Fuels up 9.85%
  15. L. Furman, 12/26/13, Energy Portfolios and Reference Indices, 2013 Summary.
  16. L. Furman, 1/22/14, Energy Portfolios: 13 Months, Sustainable Energy up 167.4%, Fossil Fuels up 9.44%
  17. L. Furman, 2/24/14, Energy Portfolios: 14 Months: Sustainable Energy up 184.4%, Fossil Fuels up 8.7%
  18. L. Furman, 3/23/14, Energy Portfolios: 15 Months: Sustainable Energy up 222.6, Fossil Fuel up 7.3%
  19. L. Furman, 4/22/14, Energy Portfolios, 16 Months: Sustainable Energy up 204.25%, Fossil Fuel up 15.38%
  20. L. Furman, 5/21/14, Energy Portfolios, 17 Months: Sustainable Energy up 211.6%, Fossil Fuels up 18.5%
  21. L. Furman, 6/24/14, Energy Portfolios, 18 Months: Sustainable Energy up 257%, Fossil Fuels up 24.6%
  22. L. Furman, 6/26/14, Energy Portfolios: 18 Months, Analysis
  23. L. Furman, 7/22/14, Energy Portfolios: 19 Months: Sustainable Energy up 222%, Fossil Fuels up 25%
  24. L. Furman, 8/23/14, Energy Portfolios: 20 Months: Sustainable Energy up 229%, Fossil Fuels up 18.4%
  25. L. Furman, 8/29 /14, Energy Portfolios: 20 Months: Conclusion & Observations
  26. L. Furman, 10/1/14, The Paradigm Is Shifting; Fossil Fuels Are Becoming Fossils
  27. L. Furman, 10/7/14, Cree: Strong Financials, But … 
  28. L. Furman, 10/21/14, Energy Portfolios: 22 Months: Sustainable Energy Up But Dropping.
  29. L. Furman, 11/27/14, Energy Portfolios: 23 Months: Sustainable Energy DOUBLED, Fossil Fuel Down (slightly).
  30. L. Furman, 12/28/14, Energy Portfolios: 24 Months: Sustainable Energy Up 91%, Fossil Fuel DOWN 10%.
  31. L. Furman, 1/27/15, Energy Portfolios: 2 Years, 1 Month, Sustainable Up 85%, Fossil Fuels DOWN 15%
  32. L. Furman, 2/23/15, Energy Portfolios: 2 Years, 2 Months, Sustainable Up 109%, Fossil Fuels DOWN 12%.
  33. L. Furman, 3/21,15, Energy Portfolios, 2 Years 3 Months: Sustainable up 128%, Fossil Fuel DOWN 16%.
  34. L. Furman, 4/21/15, Energy Portfolios, 2 Years 4 Months: Sustainable up 138%, Fossil Fuel DOWN 12%.
  35. L. Furman, 5/21/15, Energy Portfolios, 2 Years 5 Months: Sustainable up 137%, Fossil Fuel DOWN 13.7%.
  36. L. Furman, 6/21/15, Energy Portfolios, 2 Years 6 Months: Sustainable up 128%, Fossil Fuel DOWN 18%.
  37. L. Furman, 7/23/15, Energy Portfolios, 2 Years 7 Months: Sustainable up 121%, Fossil Fuel DOWN 24%.
  38. L. Furman, 8/22/15, Energy Portfolios, 2 Years 8 Months: Sustainable up 102%, Fossil Fuel DOWN 34.3%.
  39. L. Furman, 8/26/15, Energy Portfolios and “The Correction“.
  40. L. Furman, 10/1/15, Energy Portfolios, 2 Years 9 Months: Sustainable up 111.3%, Fossil Fuels DOWN 33.5%.
  41. L. Furman, 10/22/15, Energy Portfolios, 2 Years 10 Months: Sustainable Energy Up 125%, Fossil Fuel DOWN 27%.
  42. L. Furman, 11/23/15, Energy Portfolios, 2 Years 11 Months: Sustainable Energy Up 129%, Fossil Fuel DOWN 29.6%.
  43. L. Furman, 12/22/15, Energy Portfolios, 3 Years: Sustainable Energy up 166.6%, Fossil Fuel DOWN 36.2%
  44. L. Furman, 1/26/16, Energy Portfolios, 3 Years, 1 Month: Sustainable Energy UP 135.6%, Fossil Fuels DOWN 42.8%.
  45. L. Furman, 2/22/16, Energy Portfolios, 3 Years, 2 Months: Sustainable Energy Up 139.5%, Fossil Fuels DOWN 40.7%.
  46. L. Furman, 3/24/16, Energy Portfolios, 3 Years, 3 Months: Sustainable Energy Up 159.7%, Fossil Fuels DOWN 33.2%.
  47. L. Furman, 4/22/16, Energy Portfolios, 3 Years, 4 Months: Sustainable Energy Up 139%, Fossil Fuels DOWN 29.3%.
  48. L. Furman, 5/22/16, Energy Portfolios, 3 Years, 5 Months, Sustainable Energy Up 122%, Fossil Fuels Down 30%.
  49. L. Furman, 8/20/16, Energy Portfolios, 3 Years, 6 Months: Sustainable Energy Up 139%, Fossil Fuels DOWN 29.3%.
  50. L. Furman, 8/20/16, Energy Portfolios, 3 Years, 7 Months: Sustainable Energy Up 125%, Fossil Fuels DOWN 26%.
  51. L. Furman, 8/22/16, Energy Portfolios, 3 Years, 8 Months: Sustainable Energy Up 138%, Fossil Fuels DOWN 27%.
  52. L. Furman, 9/26/16, Energy Portfolios, 3 Years, 9 Months, Sustainable Energy up 133.5%, Fossil Fuels Down 31%.

A co-founder of Popular Logistics, I hold a BS and an MBA in “Managing for Sustainability” from Marlboro College, and over 20 years experience in Information Technology. Available as a speaker and consultant, I can be reached at “Popular Logistics . com” as “L Furman.”

3 Years, 8 Months: Sustainable Energy Up 138%, Fossil Fuel DOWN 27%

PLPort.1608

On Dec. 21, 2012, I imagined $16 Million dollars in equal investments in 16 real energy companies; eight Sustainable Energy companies and eight fossil fuel companies. Excluding the value of dividends and transaction costs, but including the bankruptcy or crash of three companies in the sustainable energy space and a coal company, at the close of trading on August 19, 2016:

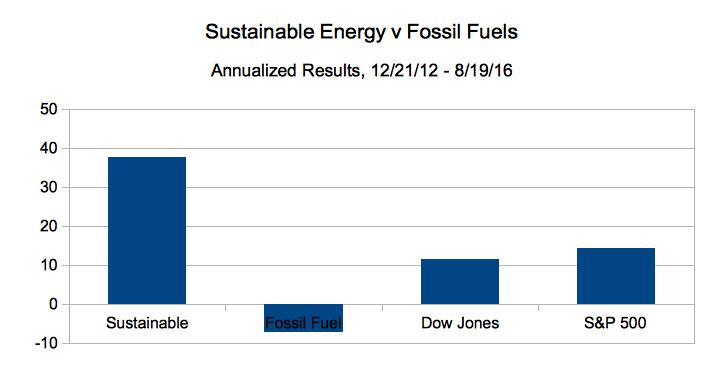
  • The Fossil Fuel portfolio went from $8.0 Million to $5.85 Million, down 25.85% overall, down 7.3% on an annualized basis.
  • The Sustainable Energy portfolio went from $8 Million to $19.1 Million, up 138.414%, overall and 37.75% on an annualized basis.
  • The Dow Jones Industrial Average is up 41.72% overall and 11.38% on an annualized basis, went from 13.091 on 12/21/12 to 18,553 on 8/21/16.
  • The S&P 500 is up 52.73% overall and 14.38% on an annualized basis, from 1,430 on 12/21/12 to close at 2,165 on 8/21/16.

Continue reading

Energy Portfolios: 3 Years, 7 Months: Sustainable Energy Up 125.2%, Fossil Fuel DOWN 25.98%

PLPort.1607 On Dec. 21, 2012, I imagined $16 Million dollars in equal investments in 16 real energy companies; eight Sustainable Energy companies and eight fossil fuel companies. Excluding the value of dividends and transaction costs, but including the bankruptcy or crash of three companies in the sustainable energy space.

As of the close of trading on July 21, 2016:

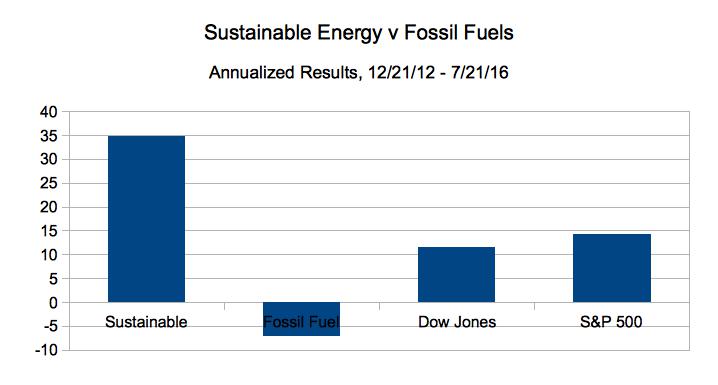
  • The Fossil Fuel portfolio went from $8.0 Million to $5.94 Million, down 25.63% overall, down 7.2% on an annualized basis.
  • The Sustainable Energy portfolio went from $8 Million to $17.98 Million, up 124.764%, overall and 34.8% on an annualized basis.
  • The Dow Jones Industrial Average is up 41.45% overall and 11.57% on an annualized basis, went from 13.091 on 12/21/12 to 18,517 on 7/21/16.
  • The S&P 500 is up 51.4% overall and 14.3% on an annualized basis, from 1,430 on 12/21/12 to close at 2,165 on 7/21/16.

Continue reading

Energy Portfolios: 3 Years, 6 Months: Sustainable Energy Up 125.2%, Fossil Fuel DOWN 25.98%

PLPort.1606

On Dec. 21, 2012, I imagined $16 Million dollars in equal investments in 16 real energy companies; $1.0 M in each company in each of eight companies in the Sustainable Energy space and $1.0 M each of eight companies in the fossil fuel space. Excluding the value of dividends and transaction costs, but including the bankruptcy or crash of various companies in the sustainable energy space and coal industry.

As of the close of trading on June 21, 2016:

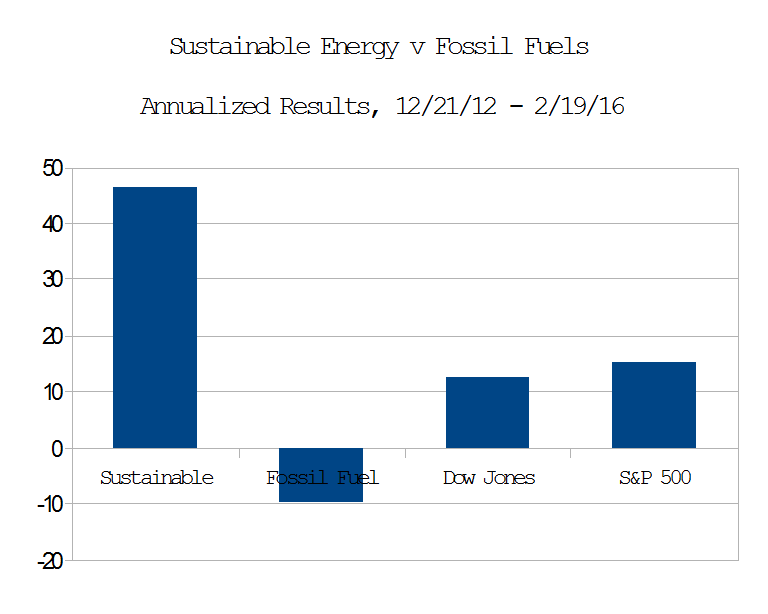
  • The Fossil Fuel portfolio went from $8.0 Million to $5.92 Million, down 25.98% overall, and 7.4% on an annualized basis.
  • The Sustainable Energy portfolio went from $8 Million to $18.019 Million, up 125.24%, overall and 35.8% on an annualized basis.
  • The Dow Jones Industrial Average is up 36.2% overall and 10.3% on an annualized basis, went from 13.091 on 12/21/12 to 17,501 on 6/21/16.
  • The S&P 500 is up 446.08% overall and 13.2% on an annualized basis, from 1,430 on 12/21/12 to close at 2089 on 6/21/16.

Continue reading

Energy Portfolios, 3 Years, 4 Months: Sustainable Energy Up 139%, Fossil Fuel DOWN 29.3%

PL_Port.40On Dec. 21, 2012, I put $16 Million imaginary dollars in equal imaginary investments in 16 real energy companies; $8.0 in the Sustainable Energy space and $8.0 in the fossil fuel space. Excluding the value of dividends and transaction costs, but including the bankruptcy or crash of three companies in the sustainable energy space, and one company in the fossil fuel space.
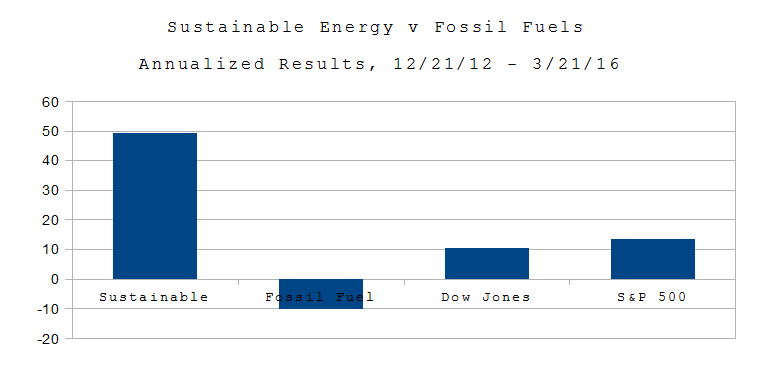
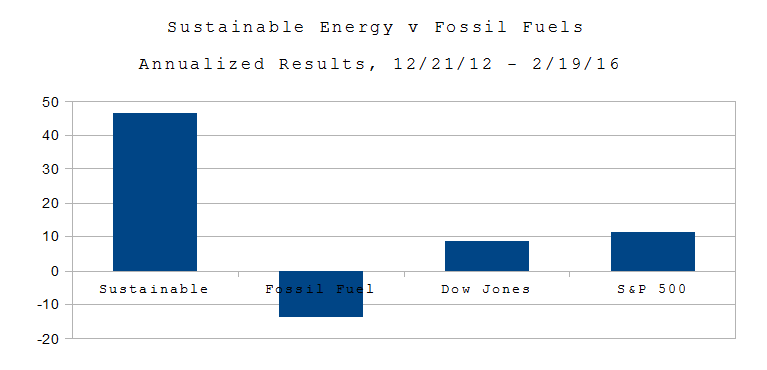
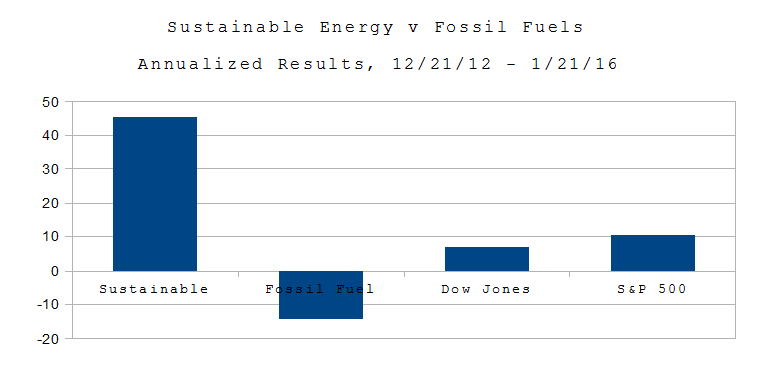
The big news this month is the bankruptcy filing of Peabody Coal (Bloomberg, here). Continue reading

Energy Portfolios, 3 Years, 3 Months: Sustainable Energy Up 159.7%, Fossil Fuel DOWN 33.2%

PLPort.1603

On Dec. 21, 2012, drying off from Sandy, after the lights came back on, I put $16 Million imaginary dollars in equal imaginary investments in 16 real energy companies; $1.0 Million in each of eight companies in the Sustainable Energy space and another $1.0 in each of eight companies in the fossil fuel space. Excluding the value of dividends and transaction costs, but including the bankruptcy or crash of three companies in the sustainable energy space,

Continue reading

Energy Portfolios, 3 Years, 2 Months: Sustainable Energy Up 139.5%, Fossil Fuel DOWN 40.7%

PLPort.1602

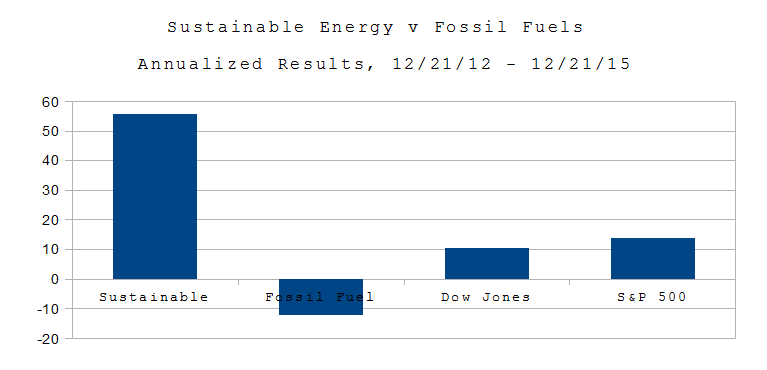
On Dec. 21, 2012, I put $16 Million imaginary dollars in equal imaginary investments in 16 real energy companies; $8.0 in the Sustainable Energy space and $8.0 in the fossil fuel space. Excluding the value of dividends and transaction costs, but including the bankruptcy or crash of three companies in the sustainable energy space …
Continue reading

Energy Portfolios, 3 Years, 1 Month: Sustainable Energy Up 135.6, Fossil Fuel DOWN 42.8%

PLPort.1601Wall St. 1/21/16. On Dec. 21, 2012, I put $16 Million imaginary dollars in equal imaginary investments in 16 real energy companies; $8.0 in the Sustainable Energy space and $8.0 in the fossil fuel space.

Today it is worth an imaginary $23.48 Million because while the Fossil Fuel portfolio dropped 42.8% of it’s total value, the Sustainable Energy portfolio increased 135.6%.

This excludes the value of dividends and transaction costs, but includes the bankruptcy or crash of three companies in the sustainable energy space.

This month’s post was delayed due to preparations for and digging out from Blizzard Jonas.

Continue reading

Energy Portfolios, 3 Years: Sustainable Energy Up 166.6%, Fossil Fuel DOWN 36.23%

PLPort.1512On Dec. 21, 2012, I put $16 Million imaginary dollars in equal imaginary investments in 16 real energy companies; $8.0 in the Sustainable Energy space and $8.0 in the fossil fuel space. Excluding the value of dividends and transaction costs, but including the bankruptcy or crash of three companies in the sustainable energy space.
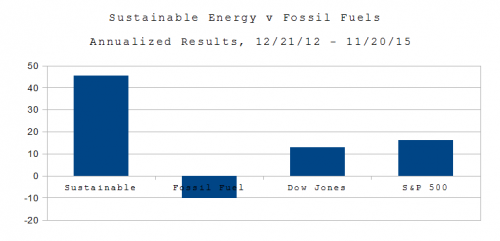
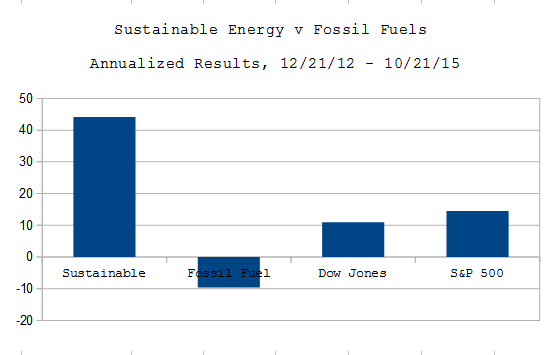
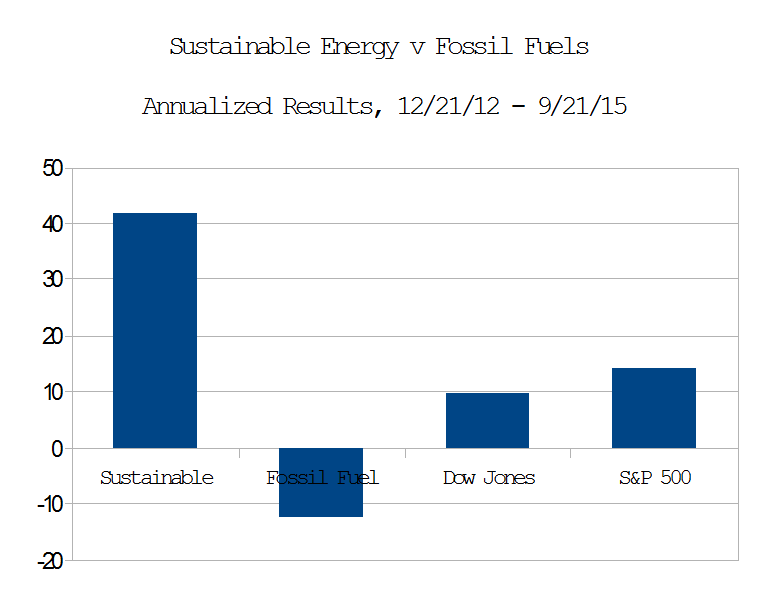
As of the close of trading on December 21, 2015:

  • The Fossil Fuel portfolio was worth $5.1 Million, down 36.23% overall, down 12.08% on an annualized basis.
  • The Sustainable Energy portfolio was worth $21.33 Million, up 166.6%, overall and 55.53% on an annualized basis.
  • The Dow Jones Industrial Average is up 31.8% overall and 10.6% on an annualized basis, from 13,091 on 12/21/12 to close at 17,252 on 10/21/15.
  • The S&P 500 is up 41.33% overall and 13.78% on an annualized basis, from 1,430 on 12/21/12 to close at 2,021 on 10/21/15.
  • If there’s a war on coal, it’s part of the war on fossil fuel – and fossil fuel is losing.

Continue reading

Energy Portfolios, 2 Years 11 Months: Sustainable Energy Up 129.5%, Fossil Fuel DOWN 29.6%

PLPort.1511On Dec. 21, 2012, I put $16 Million imaginary dollars in equal imaginary investments in 16 real energy companies; $8.0 in the Sustainable Energy space and $8.0 in the fossil fuel space. Excluding the value of dividends and transaction costs, but including the bankruptcy or crash of three companies in the sustainable energy space,

As of the close of trading on November 20, 2015:

  • The Fossil Fuel portfolio was worth $5.63 Million, down 29.57% overall, down 10.44% on an annualized basis.
  • The Sustainable Energy portfolio was worth $18.0 Million, up 129.50%, overall and 45.71% on an annualized basis.
  • The Dow Jones Industrial Average is up 36.15% overall and 10.44% on an annualized basis, from 13,091 on 12/21/12 to close at 17,824 on 10/21/15.
  • The S&P 500 is up 46.10% overall and 16.27% on an annualized basis, from 1,430 on 12/21/12 to close at 2,089 on 10/21/15.

It’s not a war on coal. It’s a paradigm shift.Think about it. We don’t use whale oil or kerosene for street lamps. We did, 100 years ago.

This of course, has geopolitical ramifications. It’s not just carbon dioxide, which is changing the climate and acidifying the oceans. Like Al Queda, Hamas and Hezbollah, ISIS finances its operations with petrodollars. (The difference is that Hamas is supported by Emirates and Kuwait, Hezbollah by Iran, Al Queda by our friends the Saudis, while ISIS has its own oil wells.) Earlier this year NJ’s Honorable Governor Chris Christie, a candidate for President, gave Exxon a $9 Billion gift (which is being challenged in the courts). BP was the beneficiary of the 1953 coup by the US under President Eisenhower and the UK which toppled the democratically elected government led by Prime Minister Mohammed Mossagedgh of Iran and propped up the Shah until the revolution in 1979.  Shell has spent something like $12 Billion in failed attempts to drill the Arctic. BP, Transocean and Halliburton brought us the Deepwater Horizon; Halliburton also profited from the US Led war in Iraq.

Continue reading

Energy Portfolios, 2 Years 10 Months: Sustainable Energy Up 125%, Fossil Fuel DOWN 27%

PLPort.1510On Dec. 21, 2012, I put $16 Million imaginary dollars in equal imaginary investments in 16 real energy companies; $8.0 in the Sustainable Energy space and $8.0 in the fossil fuel space. Excluding the value of dividends and transaction costs, but including the bankruptcy or crash of three companies in the sustainable energy space.
As of the close of trading on October 21, 2015:

  • The Fossil Fuel portfolio was worth $5.82 Million, down 27.3% overall, down 9.64% on an annualized basis.
  • The Sustainable Energy portfolio was worth $18.0 Million, up 125.0%, overall and 44.13% on an annualized basis.
  • The Dow Jones Industrial Average is up 31.15% overall and 10.99% on an annualized basis, from 13,091 on 12/21/12 to close at 17,169 on 10/21/15.
  • The S&P 500 is up 41.19% overall and 14.54% on an annualized basis, from 1,430 on 12/21/12 to close at 2,019 on 10/21/15.

Continue reading

Energy Portfolios, 2 Years 9 Months: Sustainable Energy Up 111.3%, Fossil Fuel DOWN 33.5%

PL_Port.1509On Dec. 21, 2012, I put $16 Million imaginary dollars in equal imaginary investments in 16 real energy companies; $8.0 in the Sustainable Energy space and $8.0 in the fossil fuel space. Excluding the value of dividends and transaction costs, but including the bankruptcy or crash of three companies in the sustainable energy space,

As of the close of trading on Sept. 21, 2015:

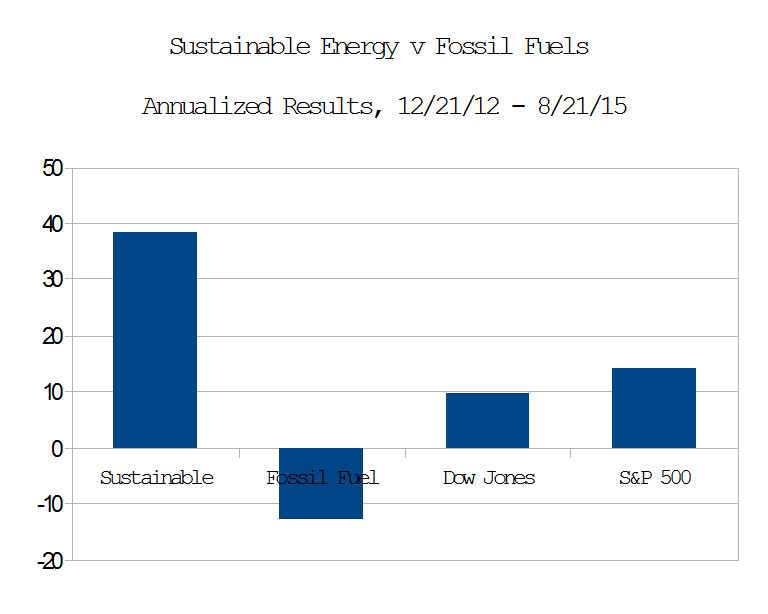
  • The Fossil Fuel portfolio was worth $5.32 Million, down 12.55% on an annualized basis.
  • The Sustainable Energy portfolio was worth $16.9 Million, up 41.74% annualized.
  • The Dow Jones Industrial Average is up 9.65% on an annualized basis, from 13,091 to 16,512 on 9/21/15.
  • The S&P 500 is up 14.3% on an annualized basis from 1,430 to close at 1,969.

Continue reading

Popular Logistics Energy Portfolios and “The Correction”

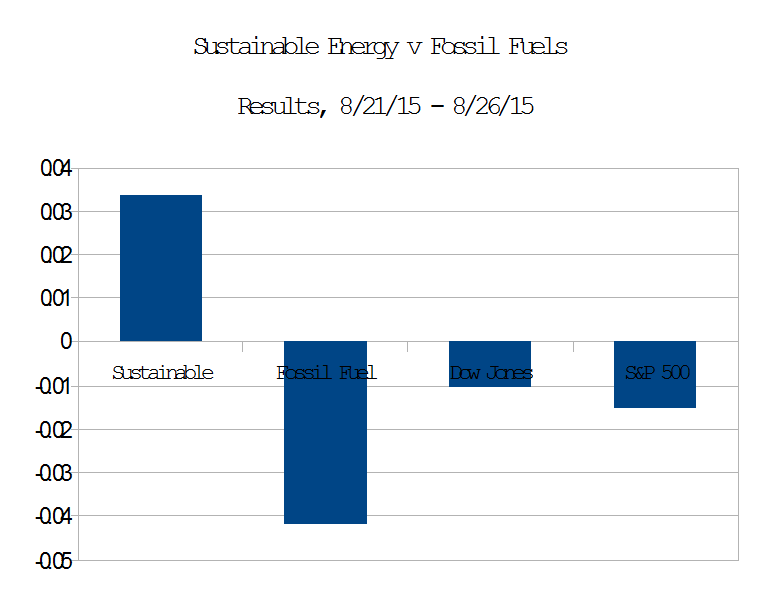
PL_Port.1508bAccording to Adam Haigh, Bloomberg Business the current stock market valuation “Correction” may be complete. Meanwhile, in the microeconomic world of energy, as illustrated above, the Sustainable Energy portfolio” I created in December, 2012, here, rose slightly above the close of trading Friday, August 21, 2015, while the Fossil Fuel portfolio, the S&P 500 index and the Dow Jones Industrial average closed below their values at the close of trading on 21 August, 2015.

Mr. Haigh, in  Asian Stocks Rise as U.S. Equity Rout Halted; China Futures Gain, wrote,

Asian stocks rose for a second day after U.S. shares halted a six-day rout.

The MSCI Asia Pacific Index gained 0.9 percent to 127.93 as of 9:05 a.m. in Tokyo. The Standard & Poor’s 500 Index jumped 3.9 percent, the most since 2011. Two things that have supported U.S. stocks in the past, dovish words from the Federal Reserve and improved economic data, halted a plunge that erased $2.2 trillion from equity values.

But the long term trend in energy stocks, first reported by me here in February, 2013, appears to be persistent. Solar and Wind stocks may be continuing to climb; Fossil fuel stocks may be continuing to decline. Either or both of these trends could, of course, reverse.

The data are summarized beginning in Table 1, below. Continue reading

Energy Portfolios, 2 years 8 months Sustainable Energy Up 103%, Fossil Fuel DOWN 34%

PLPort.1508On Dec. 21, 2012, I put $16 Million imaginary dollars in equal imaginary investments in 16 real energy companies; $8.0 Million in the Sustainable Energy space and $8.0 Million in the fossil fuel space. Excluding the value of dividends and transaction costs, but including the bankruptcy or crash of three companies in the sustainable energy space,

  • The Fossil Fuel portfolio is now worth $5.26 Million, down 34.28% overall, 12.85% on an annualized basis.
  • The Sustainable Energy portfolio is now worth $16.2 Million, up 102.6%, 38.48% on an annualized basis.
  • The Dow Jones Industrial Average is up 25.74%, 9.65% on an annualized basis, from 13,091 on 12/21/12 to close at 16,460 on 8/21/15.
  • The S&P 500 is up 37.8%, from 1,430 to close at 1,971 on 8/21/15.
  • The Fossil Fuel and Sustainable Energy portfolios, like the indices, are down in the last month.

The conclusion, that investors are moving away from Fossil Fuels and into Sustainable Energy, seems logical, if not obvious.

Continue reading