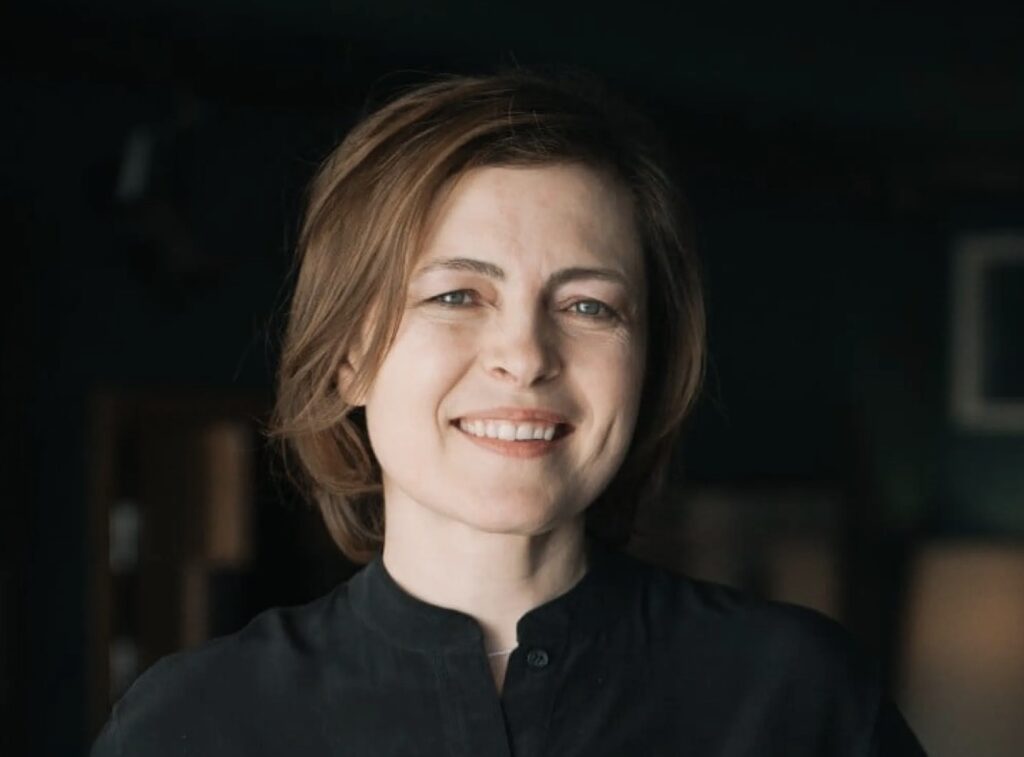
You can’t get Russian Vodka in Ontario, Alberta, Manitoba, and British Columbia, Canada (CTV News). Putin won’t notice.
Russians are protesting the invasion of Ukraine, across Russia, by the thousands (NY Times). Putin won’t care. There may be too many to put in jail – and anyway, they already are inside the gulag, they are already in jail, a jail called the Russian Federation.
Tesla, with a market capitalization of $1.137 Trillion at the close of trading on Friday, November 19, 2021, is worth more than GM, Ford, Honda, Toyota, BMW, Daimler Benz, VW COMBINED. 45% more.
Add in the value of Nisan, Hyundai, and Stellantis, which owns Fiat, Chrysler, Jeep, Maserati, Alfa Romeo, and other brands, and Tesla is still worth 25.8 % more than the rest of the major auto companies. See Table 1.
More surprising is that Tesla, is worth 39% more than Exxon Mobil, Shell, Conoco Philips, Chevron Texaco, and BP Amoco combined. See Table 2.
Arguably, Toyota set the stage for energy efficiency with the 1997 launch of the Prius (click here). And Fisker, launched in 2007, could have been Tesla. Coupled with the fact that other car companies are introducing electric vehicles, including the Chevy Bolt, the Ford Mustang Mach-e and the Ford F-150 Lightning, the Fisker Ocean, etc. it is clear that with Tesla, Elon Musk has changed the world.
Bamboo or no bamboo? That is the question. Whether tis logical to plant bamboo across America? For tis an evasive species with no natural predators, or to plant hemp, other grasses, and hardwoods and to do so as a means to natural sustainable carbon sequestration.
To place plants, to literally green the bio-humano-sphere, to create new habitat and pull carbon dioxide out of the air. And how much of the dioxide of carbon can we pull per year?
If Attila the Hun had a resume it would read, Emperor, King, Chief, and Prince. The resume would probably not describe how after his father’s death, in 418, Attila was sent by his uncle to be a servant in the Roman Court of Emperor Flavius Honorius. That, however, is the back story, as told by Wess Roberts In Leadership Secrets of Attila the Hun. (At Strand Books, here) Roberts describes Attila as a visionary, an ambitious, and charismatic leader and a strategic thinker who united the Hunnish tribes into a nation then transformed that nation into an empire. He brought Astrogoths, Alans, and others together with the Huns to try to realize his vision: to conquer Rome. And he came close.
The Soviet Union did not collapse due to actions President Reagan or the actions of any President of the United States In fact, President Roosevelt, via the Lend Lease Act during WW II, helped the Soviet Union and Great Britain withstand the onslaught of Nazi Germany. It helped win the war. (History.com, OurDocuments.gov, FDRLibrary.org.)
The Soviet Union, according to Mikhail Gorbachev, collapsed after and as a direct result of the meltdown at Chernobyl. Andropov, Gorbachev, and other members of the Central Committee realized that not only could they not hide the truth, but that the Soviet system was failing and doomed to failure. This is discussed in detail at Slate and at Faultlines.
On June 24, 1812 Napoleon led his Grand Army, 500,000 strong, across the Neman River into Russia. His goal was to persuade Tzar Alexander I not to trade with Great Britain. The Russian Army retreated before Napoleon’s, leaving a trail of burning farm fields. Napoleon made it to Moscow by mid-September, where he “captured” a deserted and burning city. Napoleon and his army camped out in the smoldering ruins for a month waiting the Tzar to sue for peace. But Alexander never did. Napoleon left Moscow on October 19, 1812, following the Russian army, with the Russian winter closing in. Napoleon’s army encountered the Russian army in the Battle of Maloyaroslavets. The battle was militarily inconclusive, but Napoleon’s army, starving and freezing, began its retreat back to Paris. In its retreat Napoleon’s army withstood attacks by the Russian army, Cossacks, and “peasants.”
On Dec. 21, 2012, I put $16 Million imaginary dollars into 16 real energy companies; $8.0 in the Sustainable Energy space and $8.0 in the fossil fuel space, $1.0 Million into each. Excluding the value of dividends and transaction costs, but including the bankruptcy or crash of three companies in the sustainable energy space,
As of the close of trading five (5) years later,
The Market Capitalization of the sustainable energy companies is up 148.6%, from $39.58 Billion to $98.4 Billion. (See Table 6, below).
The Market Capitalization of the Fossil Fuel portfolio is DOWN 3.8%, from $1.09 Trillion to $1.05 Trillion. (See Table 7, below).
And the Market Capitalization of the Big Oil companies is DOWN 2.6%,from $1.03 Trillion on 9/21/17 to $1.007 Trillion on 10/20/17. (See Table 8, below).
In addition,
The Fossil Fuel portfolio went from $8.0 Million to $6.61 Million, down 17.4% overall, down 3.48% on an annualized basis.
The Sustainable Energy portfolio went from $8 Million to $18.5 Million, up 130.6%, overall and 26.1% on an annualized basis.
The Dow Jones Industrial Average is up 89.3% overall and 17.86% on an annualized basis; from 13,091 on 12/21/12 to 24,782 on 12/21/17.
The S&P 500 is up 87.8% overall and 16.63% on an annualized basis, from 1,430 on 12/21/12 to close at 2,685 on 12/21/17.
On Dec. 21, 2012, I put $16 Million imaginary dollars into 16 real energy companies; $8.0 in the Sustainable Energy space and $8.0 in the fossil fuel space, $1.0 Million into each. Excluding the value of dividends and transaction costs, but including the bankruptcy or crash of three companies in the sustainable energy space,
In recent months the Sustainable Energy portfolio has dropped and the Fossil Fuel portfolio has increased. However, this may prove to be a short term correction that has more to do with macro-geopolitical events emanating from Washington, DC than global macroeconomic factors.
As of the close of trading 59 months later,
The Market Capitalization of the sustainable energy companies is up 148.6%, from $39.58 Billion to $98.4 Billion. (See Table 6, below).
The Market Capitalization of the Fossil Fuel portfolio is DOWN 3.8%, from $1.09 Trillion to $1.05 Trillion. (See Table 7, below).
And the Market Capitalization of the Big Oil companies is DOWN 2.6%,from $1.03 Trillion on 9/21/17 to $1.007 Trillion on 10/20/17. (See Table 8, below)
In Addition
The Fossil Fuel portfolio went from $8.0 Million to $6.06 Million, down 24.3% overall, down 4.94% on an annualized basis.
The Sustainable Energy portfolio went from $8 Million to $16.7 Million, up 108.6%, overall and 22.1% on an annualized basis.
The Dow Jones Industrial Average is up 80.2% overall and 16.31% on an annualized basis; from 13,091 on 12/21/12 to 23,591 on 11/21/17.
The S&P 500 is up 81.8% overall and 16.63% on an annualized basis, from 1,430 on 12/21/12 to close at 2,599 on 11/21/17.
On Dec. 21, 2012, I put $16 Million imaginary dollars into 16 real energy companies; $8.0 in the Sustainable Energy space and $8.0 in the fossil fuel space, $1.0 Million into each. Excluding the value of dividends and transaction costs, but including the bankruptcy or crash of three companies in the sustainable energy space,
As of the close of trading 58 months later,
The Market Capitalization of the sustainable energy companies is up 153.1%, from $39.58 Billion to $100.2 Billion. (See Table 6, below).
The Market Capitalization of the Fossil Fuel portfolio is DOWN 2.4%, from $1.099 Trillion to $1.06 Trillion. (See Table 7, below).
And the Market Capitalization of the Big Oil companies is DOWN 12.25%,from $1.03 Trillion on 9/21/17 to $1.02 Trillion on 10/20/17. (See Table 8, below)
On Dec. 21, 2012, I put $16 Million imaginary dollars into 16 real energy companies; $8.0 in the Sustainable Energy space and $8.0 in the fossil fuel space, $1.0 Million into each. Excluding the value of dividends and transaction costs, but including the bankruptcy or crash of three companies in the sustainable energy space,
As of the close of trading 57 months later,
The Market Capitalization of the sustainable energy companies is up 145.3%, from $39.58 Billion to $97.07 Billion. (See Table 6, below).
The Market Capitalization of the Fossil Fuel portfolio is DOWN 5.5%, from $1.099 Trillion to $1.029 Trillion. (See Table 7, below).
And the Market Capitalization of the Big Oil companies, PB, Exxon, Chevron, Conoco Philips and Shell, is down 11.84%, from $1.034 Trillion on 12/21/12 to $987.8 Billion on 9/21/17. (See Table 8, below).
As of the close of trading on September 21, 2017:
The Fossil Fuel portfolio went from $8.0 Million to $5.85 Million, down 26.93% overall, down 5.77% on an annualized basis.
The Sustainable Energy portfolio went from $8 Million to $20.32 Million, up 153.94%, overall and 32.99% on an annualized basis.
The Dow Jones Industrial Average is up 65.8% overall and 13.85% on an annualized basis; from 13,091 on 12/21/12 to 21,704 on 9/21/17.
The S&P 500 is up 69.8% overall and 14.69% on an annualized basis, from 1,430 on 12/21/12 to close at 2,428 on 9/21/17.
The Sustainable Energy portfolio includes First Solar (FSLR) and Sunpower Corp. (SPWR) in the solar space, Vestas (VWSYF), a wind company, Next Era Energy (NEE), a utility, Solazyme (SZYM) a biofuel company, Cree (CREE) and Lighting Sciences (LSCG) in the LED space and GT Advanced Tech (GTAT), which in Dec. 2012 made solar ovens for cooking PV wafers.
The fossil fuel companies are the oil companies British Petroleum (BP), Chevron Texaco (CVX), Conoco Phillips (COP), Exxon Mobil (XOM) and RD Shell (RDS.A), the now bankrupt coal company, Peabody Coal, and Haliburton (HAL) and Transocean (RIG), companies in the offshore oil and oil and gas drilling service industries.
The data are summarized beginning in Table 1, below.
Summary Data
Portfolio
12/21/12
09/21/17
Delta
Delta %
Annualized
Sustainable Energy
8,000,000
20,315,038
12,315,038
153.94%
32.41%
Fossil Fuel
8,000,000
5,845,911
-2,154,089
-26.93%
-5.67%
DJI
13,091
21,704
8,613
65.79%
13.85%
S&P 500
1,430
2,428
998
69.79%
14.69%
NASDAQ
3,012
5,251
2,239
74.34%
15.65%
Table 1
The stock price data for the Sustainable Energy portfolio are in Table 2, below.
Sustainable Energy Portfolio – Stock Prices
Item
Company
Symbol
12/21/12
09/21/17
Delta
Delta %
1
Cree
CREE
34.0
24.6
-9.37
-27.56%
2
First Solar
FSLR
31.0
48.8
17.76
57.29%
3
GT Adv. Tech.
GTAT
3.0
0.0
-2.98
-99.33%
4
Lighting Science
LSCG
0.8
0.0
-0.73
-97.19%
5
Next Era Energy
NEE
70.0
146.8
76.78
109.69%
6
Sun Power
SPWR
5.4
7.4
1.94
35.73%
7
Solazyme
SZYM
8.3
2.2
-6.19
-74.22%
8
Vestas
VWS
6.3
90.1
83.74
1327.10%
Note that GTATno longer exists
Table 2
The stock price data for the Fossil Fuel Portfolio are in Table 3, below.
Fossil Fuel Portfolio – Stock Prices
Item
Company
Symbol
12/21/12
09/21/17
Delta
Delta %
1
BP
BP
42.1
37.7
-4.42
-10.49%
2
Chevron Texaco
CVX
109.7
116.5
6.76
6.16%
3
Conoco Philips
COP
58.6
48.7
-9.91
-16.91%
4
Exxon Mobil
XOM
87.2
79.9
-7.34
-8.41%
5
Royal Dutch Shell
RDS.A
69.3
59.0
-10.28
-14.84%
6
Haliburton
HAL
34.7
37.9
3.19
9.19%
7
Transocean
RIG
45.6
9.1
-36.56
-80.11%
8
Peabody Coal
BTU
395.3
0.0
-395.25
-100.00%
Table 3
The valuation data for the Sustainable Energy Portfolio are in Table 4, below.
Sustainable Energy Portfolio – Valuation
Value
Delta
Item
Company
Symbol
12/21/12
09/21/17
Delta
Delta %
1
Cree
CREE
1,000
724
-276
-27.56%
2
First Solar
FSLR
1,000
1,573
573
57.29%
3
GT Adv. Tech.
GTAT
1,000
7
-993
-99.33%
4
Lighting Science
LSCG
1,000
28
-972
-97.19%
5
Next Era Energy
NEE
1,000
2,097
1,097
109.69%
6
Sun Power
SPWR
1,000
1,357
357
35.73%
7
Solazyme
SZYM
1,000
258
-742
-74.22%
8
Vestas
VWS
1,000
14,271
13,271
1327.10%
total
8,000
20,315
12,315
153.94%
Values in thousands.
Table 4
The valuation data for the Fossil Fuel Portfolio are in Table 5, below.
Fossil Fuel Portfolio – Valuations
Value
Delta
Item
Company
Symbol
12/21/12
09/21/17
Amount
Per Cent
1
BP
BP
1,000
895
-105
-10.49%
2
Chevron Texaco
CVX
1,000
1,062
62
6.16%
3
Conoco Philips
COP
1,000
831
-169
-16.91%
4
Exxon Mobil
XOM
1,000
916
-84
-8.41%
5
Royal Dutch Shell
RDS.A
1,000
852
-148
-14.84%
6
Haliburton
HAL
1,000
1,092
92
9.19%
7
Transocean
RIG
1,000
199
-801
-80.11%
8
Peabody Coal
BTU
1,000
0
-1000
-100.00%
total
8,000
5,846
-2154
-26.93%
Values in thousands.
Table 5
The market capitalization data for the Sustainable Energy Portfolio are in Table 6.
Sustainable Energy Portfolio
Market Capitalization (Billions)
Item
Company
12/21/12
09/21/17
Delta
Delta %
1
Cree
3.90
2.41
-1.49
-38.21%
2
First Solar
2.69
5.09
2.4
89.22%
3
GT Adv. Tech.
0.36
0.00
-0.35
-98.88%
4
Lighting Science
0.15
0.00
-0.15
-100.00%
5
Next Era Energy
29.60
68.87
39.27
132.67%
6
Sun Power
0.88
1.03
0.15
17.33%
7
Solazyme
0.52
0.18
-0.34
-64.72%
8
Vestas
1.48
19.48
18
1216.22%
total
39.58
97.07
57.49
145.26%
Table 6
The market capitalization data for the Fossil Fuel Portfolio are in Table 7.
Fossil Fuel Portfolio – Market Capitalization
Market Capitalization (Billions)
Item
Company
12/21/12
09/21/17
Delta
Delta %
1
BP
133.8
124.11
-9.69
-7.24%
2
Chevron Texaco
214.7
220.71
6.01
2.80%
3
Conoco Philips
71.2
59.26
-11.94
-16.77%
4
Exxon Mobil
397.7
338.50
-59.2
-14.89%
5
Royal Dutch Shell
216.8
245.19
28.39
13.10%
6
Haliburton
32.2
37.90
5.7
17.70%
7
Transocean
16.4
3.55
-12.85
-78.35%
8
Peabody Coal
6.37
0.00
-6.37
-100.00%
total
1089.2
1029.22
-59.95
-5.50%
Table 7
The market capitalization data for the Big Oil portion of the Fossil Fuel Portfolio are in Table 8.
On Dec. 21, 2012, I put $16 Million imaginary dollars into 16 real energy companies; $1.0 Million into each of eight sustainable energy companies and $1.0 Million into each of eight fossil fuel companies. Excluding the value of dividends and transaction costs, but including the bankruptcy or crash of various companies, as of the close of trading 55 months later,
The Market Capitalization of the sustainable energy companies is up 140.6%, from $39.58 Billion to $99.2 Billion. (See Table 6, below).
The Market Capitalization of the Fossil Fuel portfolio is DOWN 11.99%, from $1.09 Trillion to $968.6 Billion. (See Tables 7 & 8, below).
On Dec. 21, 2012, I put $16 Million imaginary dollars in equal imaginary investments in 16 real energy companies; $8.0 in the Sustainable Energy space and $8.0 in the fossil fuel space. Excluding the value of dividends and transaction costs, but including the bankruptcy or crash of three companies in the sustainable energy space,
As of the close of trading on March 21, 2017:
The Fossil Fuel portfolio went from $8.0 Million to $5.995 Million, down 25.05% overall, down 5.9% on an annualized basis.
The Sustainable Energy portfolio went from $8 Million to $17.7 Million, up 120.9%, overall and 28.43% on an annualized basis.
The Dow Jones Industrial Average is up 58.45% overall and 13.75% on an annualized basis, went from 13.091 on 12/21/12 to 20,743 on 3/21/17.
The S&P 500 is up 65.38% overall and 15.38% on an annualized basis, from 1,430 on 12/21/12 to close at 2,365 on 3/21/17.
The hypothetical value of the Fossil Fuel portfolio is down 33.99% overall, from $8.0 Million to $5.28 Million. This is a collapse of -8.16% on an annualized basis.
The aggregate Market Captalization of the companies in the Fossil Fuel portfolio, as of the close of trading on March 3, 2017, dropped 8.68%, from $1.089 Trillion to $994.6 Billion.
The hypothetical value of the Sustainable Energy portfolio has more than doubled since Dec. 2012. Up 117.25% overall and 28.14% on an annualized basis, from $8 Million to $17.38 Million.
The aggregate Market Capitalization of these companies, as of the close of trading on 3/3/17, increased 114.46%, from $39.58 Billion to $84.88 Billion
As of the close of trading on March 3, 2017, the Market Capitalization of the companies in the Sustainable Energy portfolio increased 114.46% from $39.58 Billion to $84.88 Billion.
In Comparison:
The Dow Jones Industrial Average is up 58.45% overall and 14.03% on an annualized basis from 13.091 on Dec. 21, 2012 to 20,743 on Feb. 21, 2017.
The S&P 500 is up 58.45% overall and 15.69% on an annualized basis, from 1,430 to 2,365.
The NASDAQ is up 94.17% overall and 22.60% on an annualized basis, from 3,021 to 5,866.
Back in December, 2012 I started this experiment in sustainable investing. I took $16 million imaginary dollars and invested them, in imaginary $1.0 Million chunks, in 8 sustainable energy companies and 8 fossil fuel companies. The results are:
The Fossil Fuel portfolio is down 18.29% overall, from $8.0 Million to $6.54 Million. This is a collapse of -4.48% on an annualized basis. However, please note that my model does not account for dividends.
The Market Capitalization of the five big oil companies of the Fossil Fuel portfolio has decreased by 4.95%
The Sustainable Energy portfolio has essentially doubled in stock price since Dec. 2012. Up 98.98% overall and 24.24% on an annualized basis, from $8 Million to $15.92 Million.
The Market Capitalization of the Sustainable Energy portfolio has increased by 87.21% in this period.
The Dow Jones Industrial Average is up 51.43% overall and 12.60% on an annualized basis from 13.091 on Dec. 21, 2012 to 19,824 on Jan. 20, 2017.
The S&P 500 is up 57.97% overall and 14.20% on an annualized basis, from 1,430 to 2,259.
The NASDAQ is up 74.54% overall and 18.20% on an annualized basis, from 3,021 to 5,251.
The Fossil Fuel portfolio is up to a point where it is only down 18% overall, from $8.0 Million to $6.56 Million. This is a collapse of -4.5% on an annualized basis.
The Sustainable Energy portfolio is up 86.75% overall and 21.69% on an annualized basis, from $8 Million to $14.94 Million.
The Dow Jones Industrial Average is up 52.33% overall and 13.1% on an annualized basis from 13.091 on Dec. 21, 2012 to 19,942 on Dec. 21, 2016.
The S&P 500 is up 58.38% overall and 14.6% on an annualized basis, from 1,430 to 2,265.
The NASDAQ is up 74.54% overall and 18.6% on an annualized basis, from 3,021 to 5,257.