You can’t get Russian Vodka in Ontario, Alberta, Manitoba, and British Columbia, Canada (CTV News). Putin won’t notice.
Russians are protesting the invasion of Ukraine, across Russia, by the thousands (NY Times). Putin won’t care. There may be too many to put in jail – and anyway, they already are inside the gulag, they are already in jail, a jail called the Russian Federation.
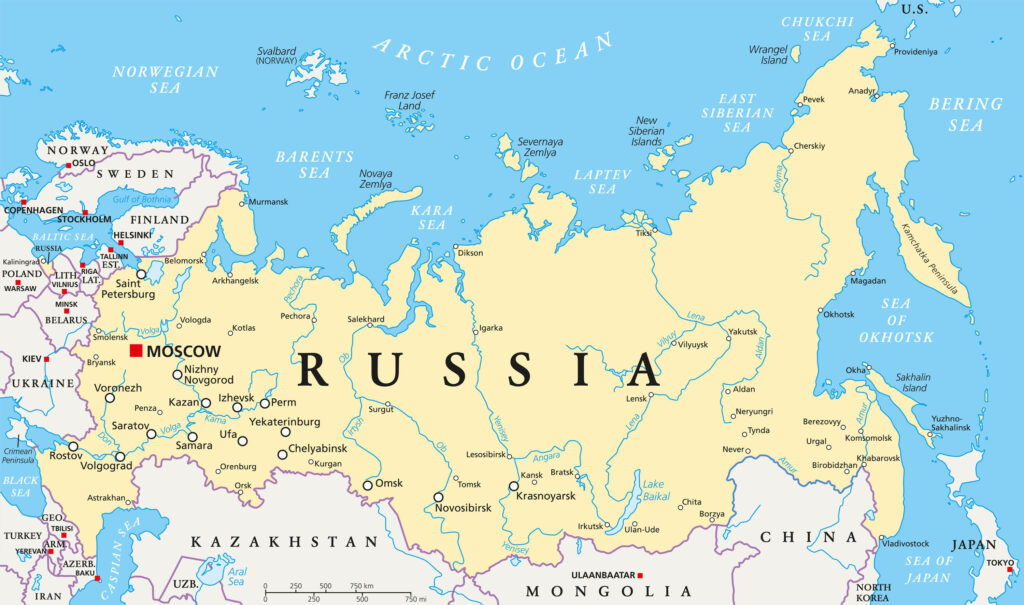
Putin appears to be recreating the Russian Empire – with himself, of course, as Tzar. While calling himself “President” not “Tzar,” he has succeeded within Russia and he has extended his dominion to Belarus and eastern Ukraine.
Russia
The rest of Ukraine is obviously next. And then? The Baltics? Poland? Czechia & Slovakia?
I have friends who remember the Soviet invasions of Hungary in 1956 (click here) and of Czechoslovakia in 1968 (here).
What Putin doesn’t want to consider is that the Soviet Union didn’t defeat Nazi Germany. Like the United Kingdom, the Soviet Union withstood Nazi Germany. This was especially true at Stalingrad, where the Nazis AND the Soviets each lost about 1.0 million soldiers. Neither the Soviets nor the British might have withstood the Nazis without the US Lend Lease program, which provided food, trucks, and weapons to UK and USSR.
My father drove and maintained some of those Chevy trucks and Jeeps. He would think Putin is an idiot, a dangerous idiot, who apparently doesn’t really know or or understand 20th Century Russian history. But just like some in America don’t want to teach American history, teaching instead some sanitized pablum, it seems that they didn’t teach Russian history in Soviet schools.
The discovery of graphene by Andre Geim and Konstantin Novoselov, for which they won the 2010 Nobel Prize in Physics ( details at Nobel.org and at Graphene-Info) may be the most significant non-medical scientific event since the discovery or invention of the transistor in 1947. Graphene is a two-dimensional lattice of carbon – think of a flexible and one atom thick flat diamond – with very interesting physical and quantum properties.
Tesla, with a market capitalization of $1.137 Trillion at the close of trading on Friday, November 19, 2021, is worth more than GM, Ford, Honda, Toyota, BMW, Daimler Benz, VW COMBINED. 45% more.
Add in the value of Nisan, Hyundai, and Stellantis, which owns Fiat, Chrysler, Jeep, Maserati, Alfa Romeo, and other brands, and Tesla is still worth 25.8 % more than the rest of the major auto companies. See Table 1.
More surprising is that Tesla, is worth 39% more than Exxon Mobil, Shell, Conoco Philips, Chevron Texaco, and BP Amoco combined. See Table 2.
Arguably, Toyota set the stage for energy efficiency with the 1997 launch of the Prius (click here). And Fisker, launched in 2007, could have been Tesla. Coupled with the fact that other car companies are introducing electric vehicles, including the Chevy Bolt, the Ford Mustang Mach-e and the Ford F-150 Lightning, the Fisker Ocean, etc. it is clear that with Tesla, Elon Musk has changed the world.
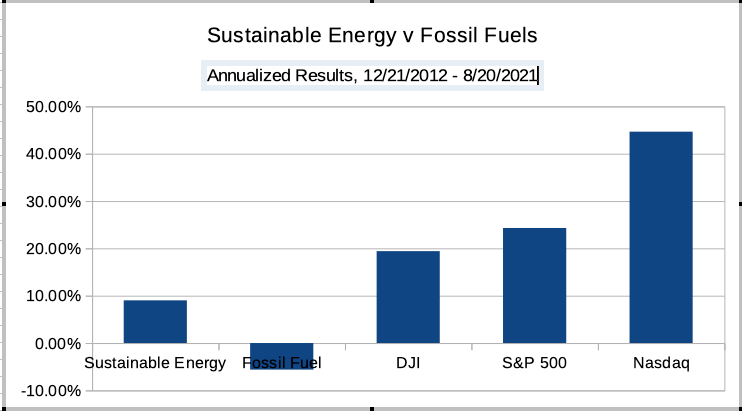
On Dec. 21, 2012, I put $16 Million imaginary dollars into 16 real energy companies; $8.0 in the Sustainable Energy space and $8.0 in the fossil fuel space, $1.0 Million into each. Excluding the value of dividends and transaction costs, but including the bankruptcy or crash of three companies in the sustainable energy space, as of the close of trading on 8/20/21, eight (8) years and eight (8) months later
The Sustainable Energy companies have increased dramatically in value, the Fossil Fuel companies have decreased in value.
Bamboo or no bamboo? That is the question. Whether tis logical to plant bamboo across America? For tis an evasive species with no natural predators, or to plant hemp, other grasses, and hardwoods and to do so as a means to natural sustainable carbon sequestration.
To place plants, to literally green the bio-humano-sphere, to create new habitat and pull carbon dioxide out of the air. And how much of the dioxide of carbon can we pull per year?
Here’s a scenario: You are Project Manager on a new and important project. You have a 6-person team. You’re writing the planning documents, and J Doe, one of the key members of the team, leaves. Abruptly. Why J. quit doesn’t really matter. Maybe he or she inherited some money and decided to split for Tahiti. Maybe J simply decided to follow other dreams – which don’t involve your project. He or she gave two week’s notice and put in a good 6-hour day for Monday thru Thursday, of the first week…. and checked out.
But you, an “Alpha Project Manager,” are undaunted. You take a deep breath, call, email, or see the sponsor (physically or virtually) and say, “J Doe quit, effective a week from Friday. This role is critical. We – that is I – need to find a replacement.”
If Attila the Hun had a resume it would read, Emperor, King, Chief, and Prince. The resume would probably not describe how after his father’s death, in 418, Attila was sent by his uncle to be a servant in the Roman Court of Emperor Flavius Honorius. That, however, is the back story, as told by Wess Roberts In Leadership Secrets of Attila the Hun. (At Strand Books, here) Roberts describes Attila as a visionary, an ambitious, and charismatic leader and a strategic thinker who united the Hunnish tribes into a nation then transformed that nation into an empire. He brought Astrogoths, Alans, and others together with the Huns to try to realize his vision: to conquer Rome. And he came close.
The Soviet Union did not collapse due to actions President Reagan or the actions of any President of the United States In fact, President Roosevelt, via the Lend Lease Act during WW II, helped the Soviet Union and Great Britain withstand the onslaught of Nazi Germany. It helped win the war. (History.com, OurDocuments.gov, FDRLibrary.org.)
The Soviet Union, according to Mikhail Gorbachev, collapsed after and as a direct result of the meltdown at Chernobyl. Andropov, Gorbachev, and other members of the Central Committee realized that not only could they not hide the truth, but that the Soviet system was failing and doomed to failure. This is discussed in detail at Slate and at Faultlines.
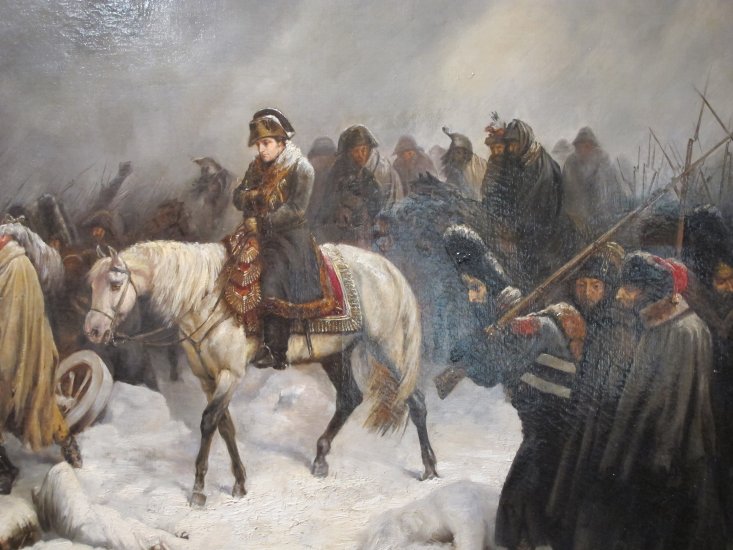
On June 24, 1812 Napoleon led his Grand Army, 500,000 strong, across the Neman River into Russia. His goal was to persuade Tzar Alexander I not to trade with Great Britain. The Russian Army retreated before Napoleon’s, leaving a trail of burning farm fields. Napoleon made it to Moscow by mid-September, where he “captured” a deserted and burning city. Napoleon and his army camped out in the smoldering ruins for a month waiting the Tzar to sue for peace. But Alexander never did. Napoleon left Moscow on October 19, 1812, following the Russian army, with the Russian winter closing in. Napoleon’s army encountered the Russian army in the Battle of Maloyaroslavets. The battle was militarily inconclusive, but Napoleon’s army, starving and freezing, began its retreat back to Paris. In its retreat Napoleon’s army withstood attacks by the Russian army, Cossacks, and “peasants.”
That’s about twice the nameplate capacity of the Oyster Creek nuclear power plant, built in the late 1960’s and turned off in 2018, at 12.8% of the cost of new nuclear.
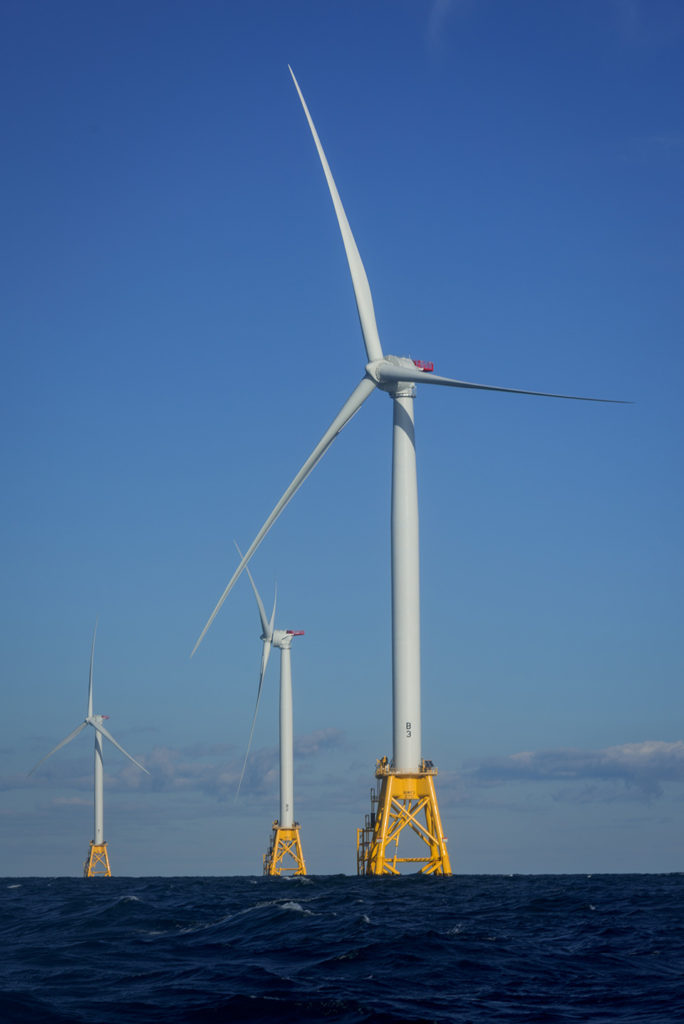
Ocean Wind will power roughly 500,000 homes beginning in 2024. NJ Gov. Phil Murphy set the state’s Energy Master Plan to build 3.5 GW offshore wind to power 1.5 million homes by 2030.
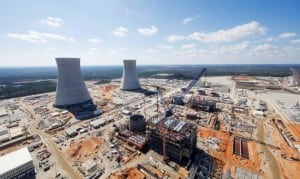
Meanwhile, in Georgia, the newest nuclear power plants, the 2.234 GW Vogtle 3 and 4, the first new nuclear reactors built in the United States in 30 years, are now 6 years late and estimated to cost $28 billion. (Taxpayer.net). That is a cost overrun of $14 billion, 100% over the initial cost of $14 billion. (Atlanta Journal Constitution, Power).
New nuclear is 8.7 times the cost of new wind power capacity. And nuclear needs fuel, waste management, and the safety and security concerns with nuclear power can not be understated.
Vogtle 3 and 4, the first new nuclear reactors built in the United States in 30 years, are now 6 years late and estimated to cost $28 billion. (Taxpayer.net). That is a cost overrun of $14 billion, 100% over the initial cost of $14 billion. (Atlanta Journal Constitution, Power).
The 2.234 GW plants at Vogtle will cost $12.5 per watt, if there are no more overruns, plus the costs of fuel, security, maintenance, etc. Utility scale solar is under $2.00 per watt. Utility scale wind is estimated at $1.44 per watt for Ocean Wind, the 1.11 GW wind farm to be built 15 miles east of Atlantic City.
Neither solar nor wind require fuel or military security forces. The money used to construct a 1 GW nuclear reactor could construct 6.5 GW of solar or 8.7 GW of wind.
Rough Comparison of New Electricity Capacity Costs
Energy
Price per watt
Capacity for $12.5 B (GW)
Nuclear
$12.50
1.00
Solar
$2.00
6.25
Wind
$1.44
8.70
Table 1
Why, given the cost of nuclear, the bankruptcy of Westinghouse, the dearth of young nuclear engineers, and the costs of wind and solar are we even thinking about, let along sinking $Billions of taxpayer dollars, in nuclear?
Miami during Hurricane Irma in 2017. Image by Kevin Hagan for the NY Times
“Climate Change,” according to Ban Ki Moon and Francis Suarez, writing in the New York Times, here, “is not a distant threat for Miami; it’s a daily presence in people’s lives. The city has been fighting to stay above water for decades. It knows that its future as a vibrant international hub for business, tourism, arts and culture depends on making the city more resilient to the impact of global warming.”
Eileen Mignoni, In “Flooding is the new normal in Miami In Miami,” here, in Yale Climate Connections, wrote, “sea-level rise is not a problem for future generations. It’s a present-day reality.
Moon, the former Secretary General of the U.N. and Suarez, Miami’s Mayor, wrote,